top of page
Data Projects: Projects


Data Projects: Pro Gallery
Data Projects: About

Data Projects: Image
Data Projects: Text
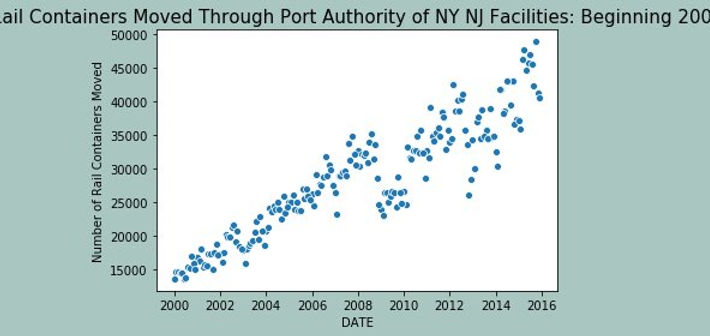
Rail Containers Moved Through Port Authority
This is a simple scatter plot showing the volume of rail containers moved through Port Authority from 2000 to 2016. The only data wrangling required was to convert the data to a date time format.
Data Description from source:
This dataset represents the total number of Rail Containers moved through Port Authority facilities in the Port of New York and New Jersey on a monthly basis from 2000 to the present
Data Source: https://catalog.data.gov/dataset/rail-containers-moved-through-port-authority-of-ny-nj-facilities-beginning-2000
Data Projects: Image
Instacart
I'm working on the data from Kaggle.com for Instacart transactions.
COMING SOON!
Data Projects: Text
bottom of page